Thomas Bulkowski replaces chart-pattern folklore with hard breakout statistics and a scoring checklist, so you can tell which setups are actually worth trading.
Key Takeaways
- Wider-spaced, longer trendlines outperform tight, short ones after breakout
- Draw up trendlines along the minor lows, not the minor highs, for earlier reversal signals
- Bulkowski's scoring system turns pattern recognition into a checklist, not a guess
- Tall chart patterns consistently beat short ones across nearly every variation tested
- Where a breakout sits in the yearly price range changes the odds more than most traders assume
About Thomas N. Bulkowski
Bulkowski describes himself as a stock trader for more than 20 years, and this book is his follow-up to his earlier Encyclopedia of Chart Patterns (Wiley, 2000). Beyond trading and writing, he mentions dabbling in magazine articles, gardening, guitar, and bird watching.
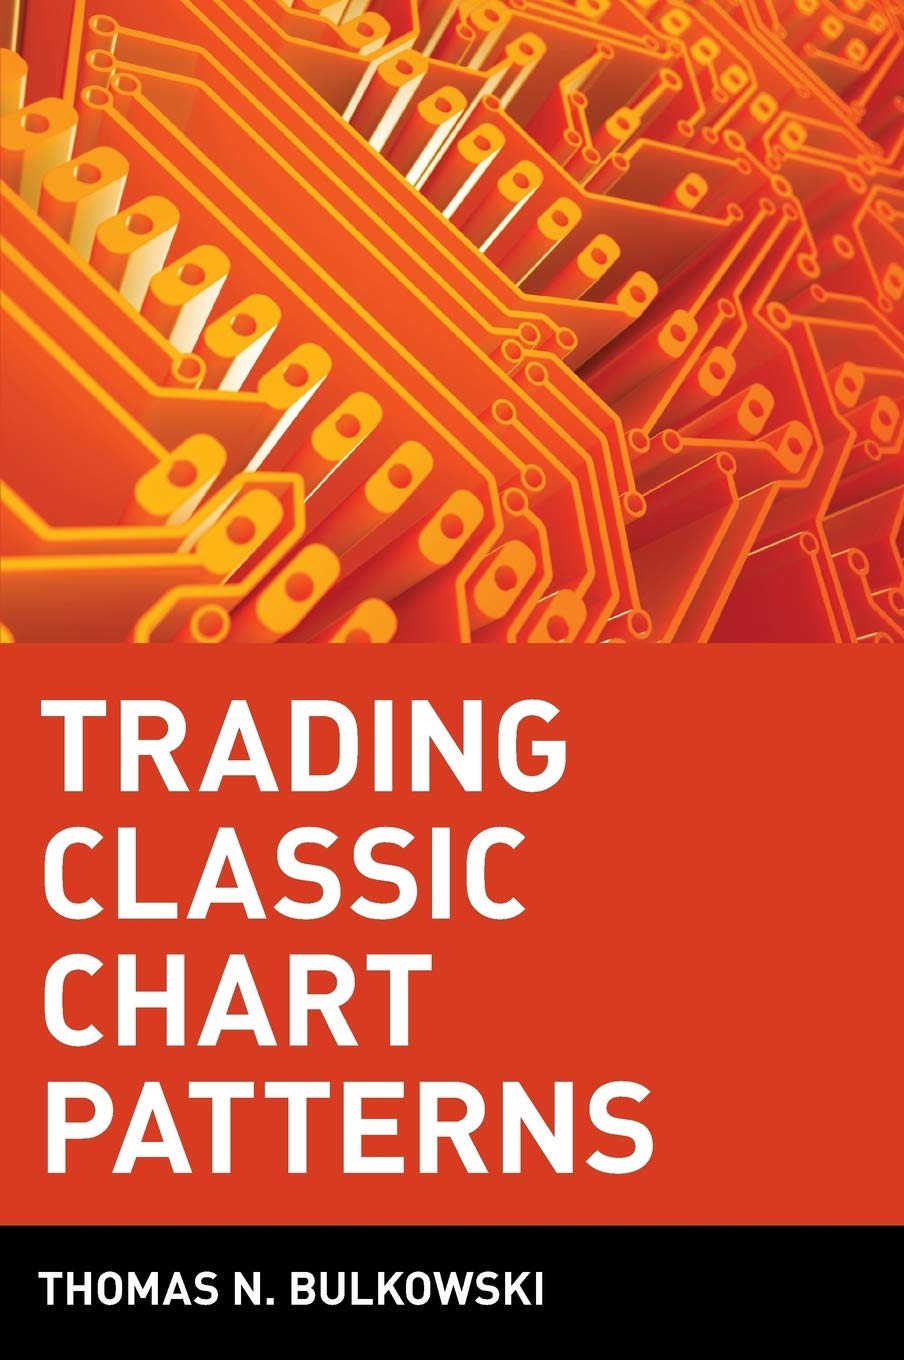
I picked up Trading Classic Chart Patterns because I wanted a straight answer to a question most chart-pattern books dodge: do these shapes actually predict anything, or are they Rorschach blots traders project their biases onto? Thomas Bulkowski doesn't answer with opinion. He answers with a database of real breakouts, sorted, scored, and tabulated pattern by pattern, then backs it with his own trading notebook.
This isn't a book for someone who's never drawn a trendline. It's for the trader who already recognizes a double top or a head-and-shoulders on sight and wants to know whether that recognition is actually worth money, and under what conditions. Bulkowski wrote it as a follow-up to his earlier Encyclopedia of Chart Patterns, and he says outright that this one goes further — testing not just whether a pattern works, but how much the general market, market capitalization, gaps at the breakout, and breakout volume influence the outcome.
Key Lessons from Trading Classic Chart Patterns
The first third of the book, "Part One: Getting Started," isn't about named patterns at all — it's about the mechanics traders think they've mastered but usually haven't: trendlines, support and resistance, stops, and the common mistakes that quietly erode returns before a pattern ever forms.
Trendlines Aren't as Simple as a Ruler and a Chart
Bulkowski tested hundreds of trendlines against actual price performance, and the results push back on some casual assumptions. Drawing down trendlines across 82 stocks and 210 trendlines, he found that wider spacing between touch points outperformed tightly clustered touches — trendlines with spacing above the 29-day median averaged 41% gains versus 36% for narrower spacing. Length mattered even more: trendlines running longer than 139 days averaged 43% gains against 33% for shorter ones. More touches helped too, with five-touch trendlines outperforming the three-touch minimum.
For up trendlines, his advice cuts against how a lot of traders eyeball a chart: draw the line along the minor lows, not the minor highs. A trendline drawn on the lows gives you an earlier, cleaner warning when the trend actually breaks, because prices touch it more consistently and a close below it flags the reversal sooner.
Support, Resistance, and Where Stops Actually Belong
The chapters on support and resistance and on stop placement work the same way — testing the conventional wisdom instead of repeating it. Bulkowski distills his money-management philosophy into what he only half-jokingly calls "Bulkowski's Law": if a stock declines, sell it. He immediately complicates that with real trade examples, including a stop-loss order that limited a loss to 11% instead of a potential 36% when a small double bottom failed to confirm.
The Mistakes That Cost the Most
A short chapter on common trading mistakes closes out Part One, walking through the psychological traps — holding losers too long, chasing unconfirmed patterns, ignoring the general market's pull on an individual stock — using Bulkowski's own losing and winning trades as the evidence rather than abstract warnings.
The Scoring System: Bulkowski's Investment Checklist
The organizing idea of the whole book is a scoring system. For each major chart pattern covered in Part Two, Bulkowski breaks the pattern down by variable — breakout direction, formation height, volume, position within the yearly price range, and more — and assigns a score of +1 or -1 to each, based on whether that variable historically helped or hurt performance. Add up the scores for a setup you're evaluating, and a total above zero suggests better-than-median performance; below zero suggests you should probably look elsewhere.
He's explicit that this isn't meant to be a mechanical system you run on autopilot. It's a filter — a way, as he puts it, to separate the chart pattern purebreds from the mongrels before you commit capital.
Trading Classic Chart Patterns Chapter Breakdown
The book splits cleanly into two parts. Part One (Chapters 1–5) covers down trendlines, up trendlines, support and resistance, stops and selling, and common trading mistakes. Part Two is the reference section, running alphabetically through the classic patterns: broadening tops, diamonds, double bottoms, double tops, head-and-shoulders bottoms and tops, rectangles, ascending and descending scallops, ascending, descending, and symmetrical triangles, and triple bottoms and triple tops. The book closes with a statistics summary and analysis chapter that ranks the patterns against each other, followed by a glossary and methodology section.
Each pattern chapter follows the same rhythm: identification rules, a scoring table built from real breakout data, and a discussion of what actually moves the needle for that specific pattern — height, volume, prior trend, or where the breakout sits in the yearly price range.
What the Data Actually Shows
The real value of this book is in the specifics, not the generalities. In the double tops chapter, tall patterns — formation height above the median — consistently outperformed short ones across every variation Bulkowski tracked, including Adam & Adam, Adam & Eve, Eve & Adam, and Eve & Eve tops. He also found that most double tops breaking out from the middle or upper third of the prior year's price range outperformed those breaking out near the yearly low, which runs against what a lot of traders assume about bearish setups near a low.
The statistics summary chapter takes this further, ranking patterns by failure rate against target price rises. Aiming for a 15% move, head-and-shoulders bottoms and ascending triangles both showed meaningfully lower failure rates than several of the other bullish patterns in the book — the kind of side-by-side comparison that's genuinely hard to find written down anywhere else in the chart-pattern literature.
A Closer Look: Head-and-Shoulders Bottoms
The head-and-shoulders bottoms chapter is a good example of how thorough Bulkowski gets with a single pattern. He notes that volume is usually highest during formation of the left shoulder or the head, and diminishes on the right shoulder, and that the neckline connecting the two shoulders has a slight tendency — about 55% of the time — to slope downward rather than flat or up. He also flags a specific identification trap: traders forcing an "A-B-C" shape onto a chart where the shoulders aren't actually distinct minor lows, and asks a simple test question worth remembering — will other traders looking at the same chart see the same pattern? If not, it probably isn't one.
On timing, he found that head-and-shoulders bottoms preceded by only a short-term downtrend performed best, averaging 38% gains after breakout — beating the 34% average across all head-and-shoulders bottoms in his sample, and beating both intermediate and long-term prior downtrends by a clear margin. That's the kind of granular, checkable detail that separates this book from the generic "here's what the pattern looks like" treatment you get elsewhere.
Where the Book Falls Short
My honest pushback: this book demands patience and a comfort with dense tables that not every trader has. Bulkowski's data comes from a specific historical window and a specific universe of stocks — market regimes shift, and a failure rate calculated from trades made decades ago isn't a guarantee of what happens next. He acknowledges this himself, framing the scores as a checklist rather than a mechanical system, but it's easy to read 400-plus pages of statistics and start treating them as gospel anyway. I'd also have liked one clean summary table letting you compare every pattern side by side up front, rather than having to build that comparison yourself chapter by chapter. The prose style is chatty and self-deprecating — Bulkowski leans on running jokes, carpal tunnel from drawing hundreds of trendlines, a running Star Trek bit about the criticism his first book drew — which makes the numbers easier to sit through, but it also means the real substance is spread thinner across each chapter than a pure reference book would allow.
Who Gets the Most from This Book
This book rewards a trader who already trades chart patterns by eye and wants to know which of their setups are statistically worth the risk — someone who can spot a head-and-shoulders top on a chart but has no real idea whether it actually outperforms a symmetrical triangle. It's less useful as a first introduction to charting, and it's not a book for someone looking for a plug-and-play automated system; Bulkowski built it as a reference, and it reads like one.
Final Verdict
I'd recommend this to any technical trader serious enough to want evidence instead of folklore. What surprised me most was how often the data contradicted the tidy rules-of-thumb repeated in other trading books — wide trendline spacing beating tight spacing, tall patterns beating short ones more consistently than intuition suggests. My pushback is that the book asks a lot of you in return: it's reference material more than a linear read, and you'll get far more out of it with a highlighter and a second pass than a single sitting on the couch.
For a faster way into the core ideas — the scoring logic, the pattern-by-pattern breakdown, and the numbers that matter most — check the condensed notes and resources in the sidebar.
Notable Quotes
“"If I've told you once, I've told you a thousand times. Don't exaggerate!"”
“"Think of this book not as advocating a trading system, but as a system"”
Who Should Read This
Traders who already recognize chart patterns on sight but want statistical proof of which setups actually outperform, and by how much.
Who Should Skip This
Complete beginners looking for an introduction to charting, and anyone hoping for a plug-and-play mechanical system rather than a data-driven checklist.
How It Compares
Where Edwards and Magee's classic Technical Analysis of Stock Trends teaches pattern identification largely through descriptive rules, Bulkowski replaces description with measured outcomes — closer in spirit to his own Encyclopedia of Chart Patterns, but narrower in scope and built around his actionable scoring checklist rather than a full reference catalog.
Final Verdict
This is one of the few chart-pattern books that actually shows its work, and the specificity is what makes it worth the time — trendline spacing and length, formation height, and breakout position in the yearly range all turned out to matter more than I expected. My honest pushback is that it reads like a reference manual, not a story, and the historical dataset behind the stats won't perfectly map onto today's markets, so treat the scores as a filter, exactly as Bulkowski intends, not as a guarantee.