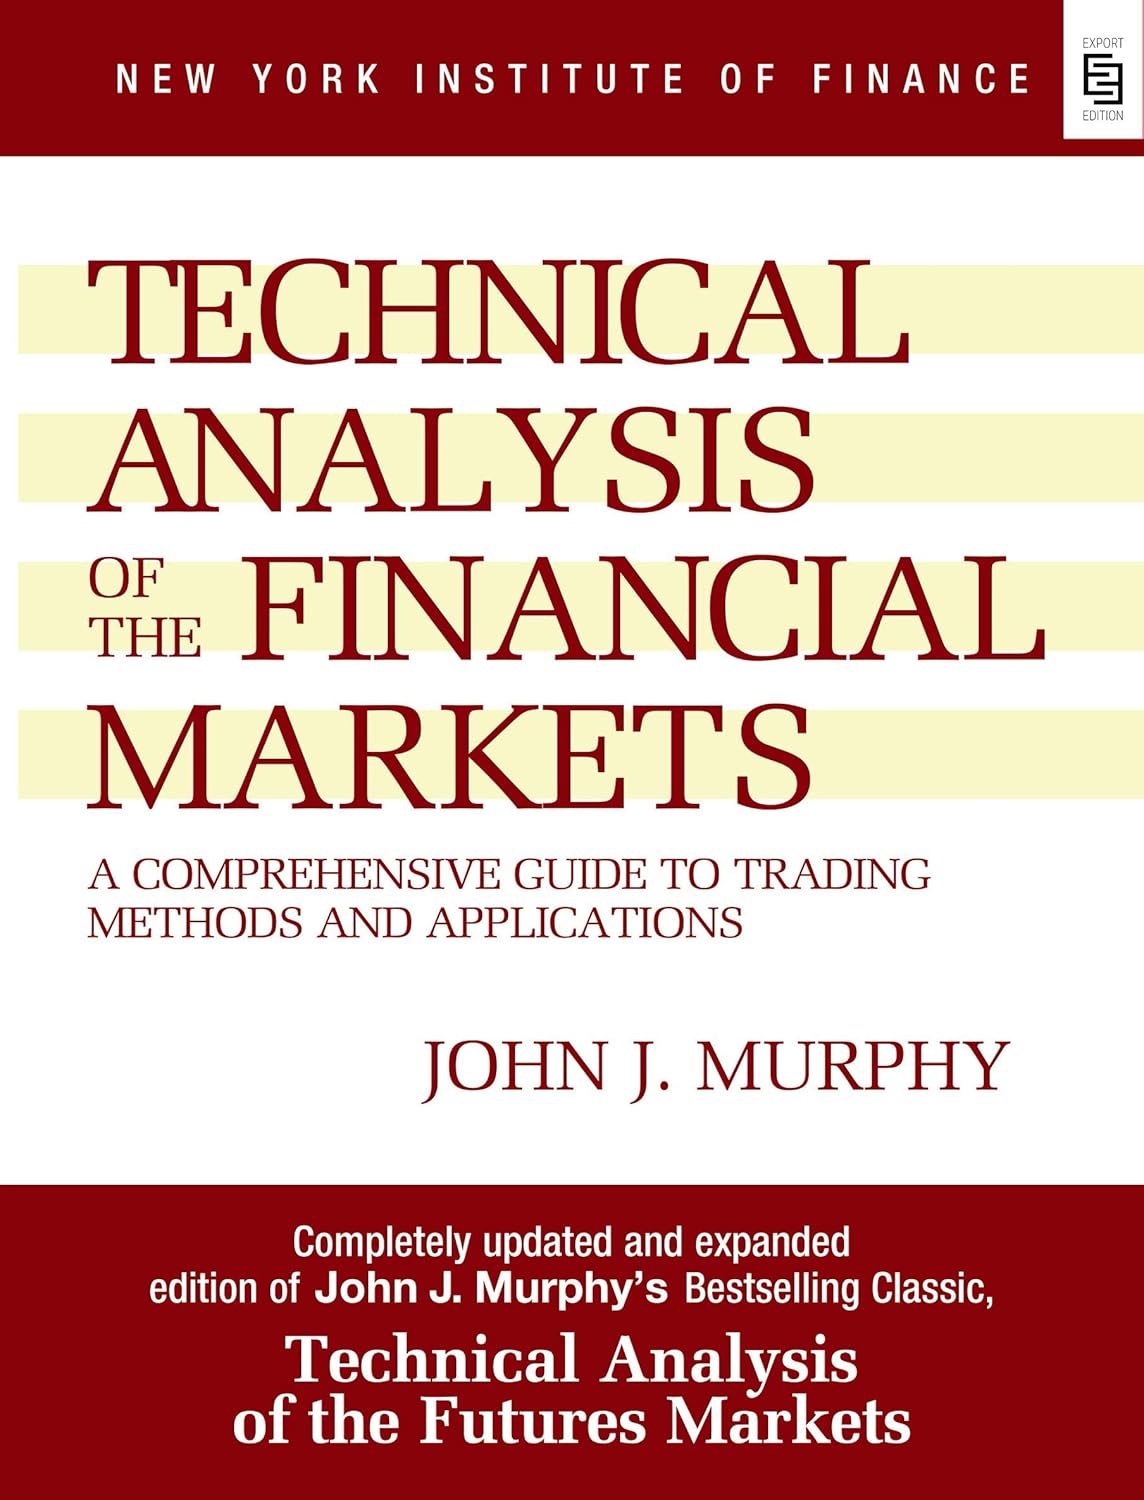
John Murphy's 500+ page reference distills every major school of chart analysis — Dow Theory to Elliott Wave — into one system for reading what price is actually telling you.
Key Takeaways
- Chart reading is treated as a faster route to the same conclusions fundamental analysis eventually reaches
- Dow Theory's three-phase trend structure directly foreshadows Elliott Wave's five-wave pattern
- Trend-following systems like Parabolic SAR work great in trends and whipsaw badly in sideways markets
- Randomness in price action is framed as a failure to spot the pattern, not proof no pattern exists
- Even Murphy admits chart reading stays partly subjective — experienced technicians still disagree on interpretation
About John J. Murphy
John J. Murphy has applied technical analysis for three decades. He was formerly Director of Futures Technical Research and senior managed-account trading advisor at Merrill Lynch, and served as CNBC-TV's technical analyst for seven years. In 1996 he founded MURPHYMORRIS, Inc. with software developer Greg Morris, and he also heads his own consulting firm, JJM Technical Advisors, in Oradell, New Jersey.
I keep this one on the shelf I actually reach for, not the one I show off. "Technical Analysis of the Financial Markets" isn't a book you read cover to cover for fun — it's the book you pull down when you need to remember exactly how a head-and-shoulders pattern is supposed to behave, or what Dow actually meant by "the averages must confirm each other." John Murphy wrote it as a 1999 revision and expansion of his earlier "Technical Analysis of the Futures Markets" (1986), and the shift in scope is the whole point: this version pulls in stocks, mutual funds, and intermarket relationships alongside the original futures focus.
If you've ever felt like technical analysis is a pile of disconnected tools — some guy's oscillator here, someone else's candlestick pattern there — this book is Murphy's attempt to show you the connective tissue between all of it.
Key Lessons from Technical Analysis of the Financial Markets
Price Already Knows What You're Waiting to Find Out
The foundational argument of the book is one most chartists have heard a hundred times but rarely see defended this thoroughly: market price already reflects everything knowable about a security, so reading the chart is a faster route to the same conclusion a fundamental analyst is working toward. Murphy puts it bluntly — chart reading becomes a shortcut form of fundamental analysis. His argument isn't just philosophical; he walks through why fundamentalists tend to specialize in one market out of necessity, while a technician can rotate attention across dozens of markets and simply follow wherever the trends currently are.
Dow Theory Still Runs Underneath Everything
Murphy spends real time re-grounding modern technical analysis in Charles Dow's original tenets from the turn of the 20th century — the idea that averages discount everything, that trends move in three sizes (he uses the tide/wave/ripple analogy), and that a major trend unfolds in three phases: accumulation by informed money, public participation, and distribution. What struck me is how directly this maps onto Elliott Wave's five-wave structure, which Murphy points out explicitly — R.N. Elliott essentially formalized what Dow had already sketched decades earlier.
Trend-Following Systems Work Until They Don't
The chapter on computerized trading systems is refreshingly honest about the limits of mechanical approaches. Using Welles Wilder's Parabolic SAR as the case study, Murphy shows chart after chart where the system captures a strong trend beautifully — and then whipsaws repeatedly through sideways, non-trending stretches. It's a rare moment of a technical-analysis author admitting a tool's failure mode instead of just selling its wins.
Technical Analysis of the Financial Markets Chapter Breakdown
The book's 18 chapters build in a genuinely logical sequence rather than reading like a grab-bag of topics stapled together:
- Chapters 1–2 (Philosophy and Dow Theory): lay the theoretical foundation — why technical analysis works and where its core assumptions originate.
- Chapters 3–8 (Chart Construction through Long Term Charts): the mechanics — trendlines, support and resistance, reversal and continuation patterns, volume and open interest.
- Chapters 9–14 (Moving Averages through Time Cycles): the indicator toolbox — oscillators, point and figure charting, Murphy's newly added chapter on Japanese candlesticks, Elliott Wave, and cycle theory.
- Chapters 15–16 (Computers and Trading Systems, Money Management): turning theory into an actual executable system, with real attention paid to position sizing and risk-to-reward — a section a lot of TA books skip entirely.
- Chapters 17–18 (Intermarket Analysis, Stock Market Indicators): the two chapters original to this 1999 edition, extending Murphy's earlier futures-focused work into stocks, bonds, the dollar, and sector rotation.
The appendices are worth knowing about too — they cover Market Profile, advanced indicators like the Demand Index and Herrick Payoff Index, and a five-step framework for building and testing your own trading system.
Where the Book Pushes Back on Its Critics
One of the more satisfying sections is Murphy's direct engagement with Random Walk Theory and the efficient market hypothesis — the academic position that price history can't predict future price direction. Rather than dodging it, he takes it head-on, arguing that randomness is often just a failure to recognize a pattern rather than proof no pattern exists. His line on this has stuck with me: the illusion of randomness gradually disappears as the skill in chart reading improves. He also tackles the "self-fulfilling prophecy" criticism of charting — that patterns work only because enough traders believe in them — by pointing out that if that were the whole story, every technician would already be rich.
What I'd Push Back On
For all its thoroughness, this book shows its age in specific, occasionally distracting ways. The computer chapter recommends specific late-1990s charting software and data vendors by name, phone number included — a detail that dates the material the moment you read it. More substantively, Murphy's own admission that "chart reading is an art" and that experienced chartists routinely disagree on interpretation cuts both ways: it's honest, but it also means a lot of what's presented as a rigorous system still comes down to subjective judgment calls the book can't fully resolve for you. If you're looking for a purely mechanical, backtestable rulebook, you won't find one here — you'll find a very well-organized case for developing your own eye.
My Verdict
This earns its reputation as a reference text, not a page-turner. It's the book I'd want next to me while actually looking at a chart, not the one I'd recommend for a first pass at learning to trade. Murphy's real strength is synthesis — showing how Dow Theory, Elliott Wave, oscillators, and money management all fit into one coherent framework instead of competing schools of thought.
Check the sidebar for my condensed notes and resource links if you want a faster way back into this material without re-reading all 500-plus pages.
Notable Quotes
“"Chart reading becomes a shortcut form of fundamental analysis."”
“"The illusion of randomness gradually disappears as the skill in chart reading improves."”
“"It has been referred to by many in the field as the 'Bible' of technical analysis."”
Who Should Read This
Traders who already know basic chart-reading and want one organized reference tying Dow Theory, indicators, and money management into a single framework, rather than a beginner's first introduction.
Who Should Skip This
Strict fundamentalists who won't buy the core premise that price discounts everything, and absolute beginners who'd be better served starting with a shorter, more example-driven intro before tackling a 500-plus page reference.
How It Compares
It sits in the same category as Edwards and Magee's "Technical Analysis of Stock Trends" and Pring's "Technical Analysis Explained" — but where Edwards and Magee stay narrowly focused on classical chart patterns, Murphy's book is broader, folding in candlesticks, Elliott Wave, cycles, and intermarket analysis into one volume.
Final Verdict
This is a genuinely thorough synthesis of technical analysis schools rather than a quick-read pitch for any single method — and that's both its strength and its drawback. What surprised me most was how directly Murphy engages academic critics like Random Walk theorists instead of ignoring them. What I'd push back on is the book's occasional dated specificity (naming 1990s software vendors) and its honest but unresolved admission that chart interpretation still comes down to subjective skill. Worth owning as a reference; not the book to start with if you've never opened a chart before.