A trader-friendly walkthrough of chart patterns, trendlines, and stop-loss discipline, built around a fictional trader who keeps blowing up his account.
Key Takeaways
- Trade with the trend — the same pattern performs differently in a bull market versus a bear market.
- A stop-loss order removes the emotional decision of whether to sell, and separates amateurs from professionals.
- A "busted" pattern (less than a 10% move before reversing) can be its own profitable setup, not just a failed trade.
- Support and resistance zones flip roles — broken resistance becomes new support, and vice versa.
- Match your expectations to reality: most traders win between 40% and 60% of the time, not 80%+.
About Thomas N. Bulkowski
[NEEDS INPUT] — the source material doesn't include an author bio (no "About the Author" section was present in this copy of the book).
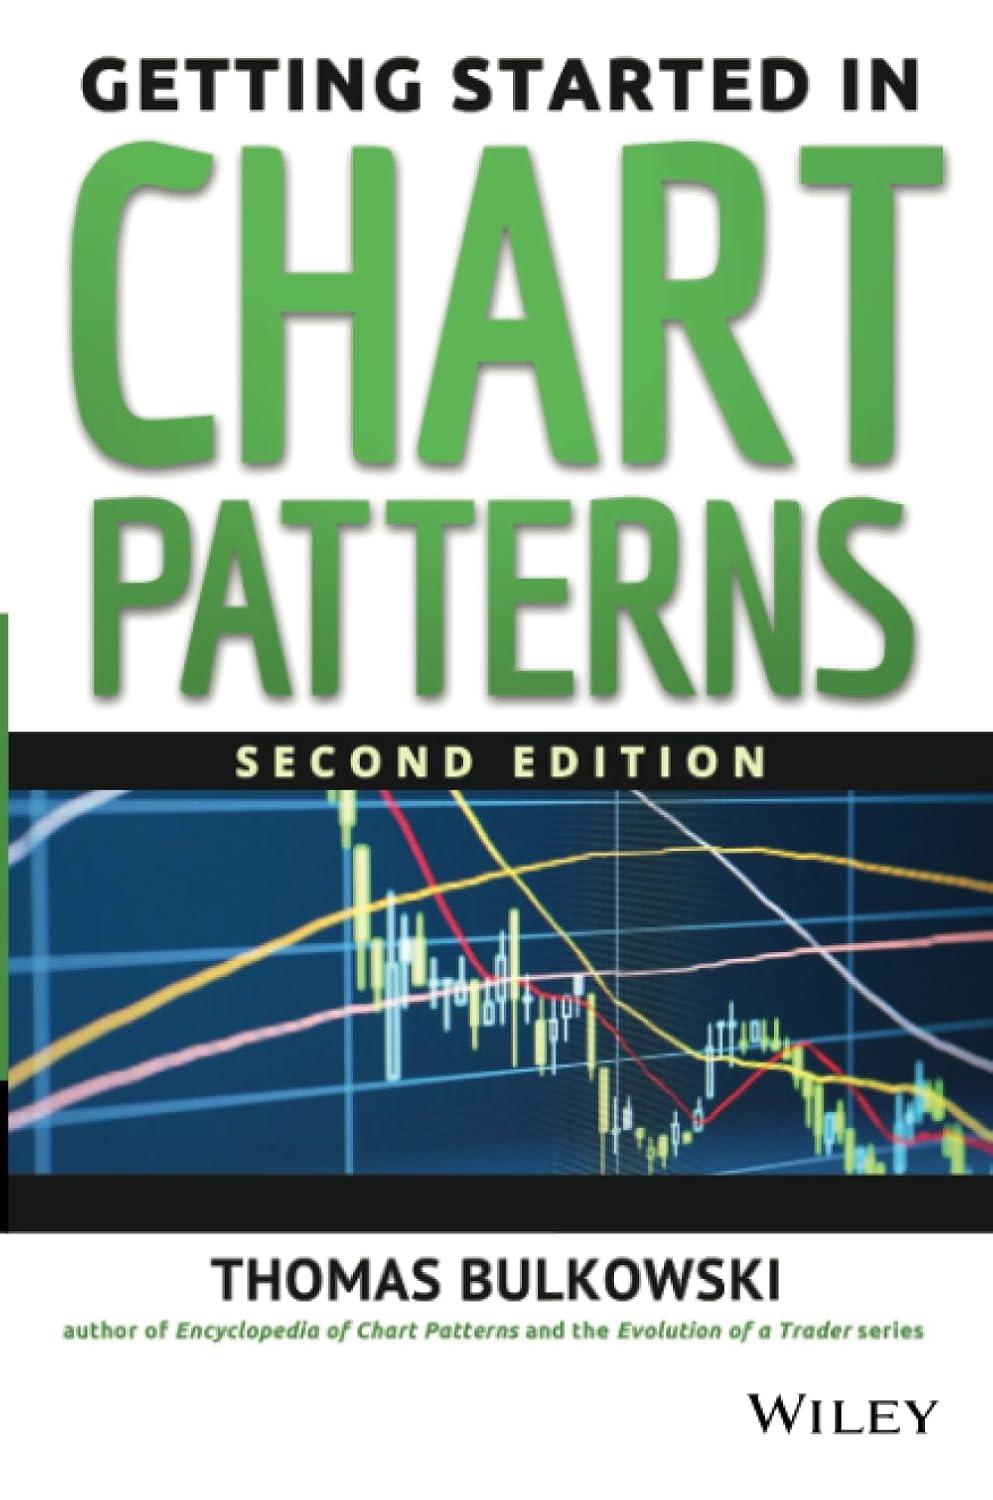
I picked up Getting Started in Chart Patterns expecting a dry checklist of triangles and flags. What I got instead was a book built around a fictional trader named Jake who keeps blowing up his account — and a chapter on trading psychology that comes before a single chart pattern gets explained. That ordering tells you everything about Thomas N. Bulkowski's priorities here.
This is part of Wiley's "Getting Started In" series, so it's aimed squarely at newer traders and investors, not the quant crowd. If you already own Bulkowski's dense reference work, the Encyclopedia of Chart Patterns, this is the narrative, story-driven companion that explains why those patterns matter before it hands you the numbers.
What Getting Started in Chart Patterns Is Actually About
Bulkowski frames chart patterns as "the footprints of smart money" — the idea that informed buying and selling leaves visible traces on a price chart, and that reading those traces correctly is a skill you can build. He backs that claim with statistics pulled from his own study of more than 38,500 chart and event patterns, and he's upfront that those numbers assume perfect trades with no commissions — a benchmark for comparison, not a promise of your own returns.
The book uses a recurring literary device: Jake, a composite fictional trader, shows up in dialogue throughout to make mistakes, ask the obvious questions, and occasionally report a real trade Bulkowski actually made. It's an unusual choice for a technical-analysis book, and it mostly works — it keeps chapters that could read like a stats appendix feeling like a conversation instead.
Key Lessons from Getting Started in Chart Patterns
Psychology Comes Before Patterns
Chapter 2 arrives before any chart pattern is taught, and it's built around a simple gambling experiment: offered a guaranteed $500 gain versus a coin-flip for $1,000 or nothing, most people take the sure thing — but flip the frame to losses, and the same people gamble on the coin flip rather than accept a certain loss. Bulkowski uses that asymmetry to explain why traders cut winners short and let losers run, which is exactly backwards from what a profitable system requires.
His fix is blunt:
"Unwillingness to use a stop is what separates an amateur trader from a professional."He also walks through visualization exercises for reframing negative self-talk, and claims — citing his own experience helping his mother rebuild confidence after a loss — that it takes about three weeks of repetition before a new mental habit actually sticks.
Trendlines, Properly Drawn
Chapter 3 breaks trendlines into three types — external, internal, and curved — and makes a point that trips up a lot of self-taught chartists: a trendline connecting two prior peaks can cap a rally even after a bullish breakout confirms. He shows this with a falling-wedge trade where the textbook breakout was real, but a second trendline above it stalled the move exactly where geometry predicted.
Support and Resistance Zones Come First, Not Last
Bulkowski calls support and resistance the single most important chart pattern concept in the book, and he explains it as pure supply and demand: a support zone is where buying pressure has repeatedly stopped a decline, and a resistance zone is where selling pressure has repeatedly capped a rise. His clearest example is a triple top, where three peaks stall at the same price and form a ceiling — until price closes below the lowest valley between those peaks, confirming the pattern and signaling further downside. He's also careful to note that the relationship flips: a support line that gets broken often turns into resistance on the way back up, and a broken resistance line can become the new floor.
He folds Fibonacci retracements into this same chapter, using 38%, 50%, and 62% retracement levels to predict where a pullback within a larger trend is likely to stall — treating them as another way to estimate the same support and resistance zones rather than a separate system.
Trade With the Market, Not Against It
Using ascending triangles as his example, Bulkowski shows that the same pattern performs differently depending on the broader market: upward breakouts averaged a 35% gain in a bull market versus a 30% gain in a bear market, while downward breakouts fared worse in a bear market than in a bull one. His takeaway is to match pattern direction to the prevailing trend — both the overall market and the stock's own industry group — rather than trading a bullish setup into a falling market and hoping the pattern wins the argument.
Busted Patterns: Trading the Failure Itself
The most distinctive chapter here is on "busted" patterns — his term for a chart pattern that moves less than 10% after the breakout before reversing hard the other way. Rather than treating a busted pattern as a failed trade to avoid, Bulkowski treats it as its own tradable setup, arguing that busted moves can outrun the performance of the original, unbusted pattern. He illustrates the idea with a personal trade in Questar Corporation: a symmetrical triangle broke out downward, he took the sell signal for a small loss, and two days later the stock reversed and ran 15% higher — a busted trade he says he'd take the same way again, because obeying the signal matters more than any single outcome.
Getting Started in Chart Patterns Chapter Breakdown
The book runs twelve chapters plus a glossary and a reprinted index of chart and event patterns from the Encyclopedia:
- Ch. 1–2, The Smart Money's Footprints / Trading Psychology: Why patterns work and why your own head is the first obstacle to trading them.
- Ch. 3–4, Trendlines / Support and Resistance: The two foundational tools everything else in the book builds on.
- Ch. 5, Special Situations: Bull and bear markets, bull and bear traps, and other context that changes how a pattern should be read.
- Ch. 6–7, Top 10 Performing Bottoms / Common Patterns for the Toolbox: The core catalog of chart patterns, ranked and explained.
- Ch. 8, Event Patterns: Patterns triggered by news — earnings, upgrades, downgrades — rather than pure price action.
- Ch. 9, Busted Patterns: Trading the failure of a pattern as its own strategy.
- Ch. 10–11, More Trades / The Art of Trading — Checklists: Worked trade examples and the checklists Bulkowski actually uses before entering a position.
- Ch. 12, Crunching the Numbers: The statistical backbone behind the performance figures cited throughout the book.
The Checklists That Turn Theory Into a Routine
Chapter 11 is less about chart patterns and more about the actual daily discipline behind trading them. Bulkowski describes himself as an end-of-day position trader who checks a watchlist of 350 securities, ranks them by industry relative strength, and reads the Wall Street Journal each morning circling anything relevant — earnings, upgrades, downgrades, insider transactions. The "Before Buying" checklist that follows is the most practical stretch of the book: check the general market averages, confirm the trend on a higher time scale, check how other stocks in the same industry are behaving, and only then look for the pattern itself. It's a reminder that pattern recognition is the last step in his process, not the first.
What I'd Push Back On
The Jake dialogue is charming for the first few chapters, but by the middle of the book it starts to slow sections down that would be more useful as tighter reference material — there are stretches where you're waiting through a scene to get to the actual chart pattern rule. And while Bulkowski is honest that his percentages come from a database of historical trades with no commissions, no slippage, and perfect exits, it's worth repeating to yourself every time a number like "35% average gain" appears: that's the ceiling, not a plan.
Who Should Read This
This is best for traders who can already recognize a triangle or a head-and-shoulders on a chart but keep hesitating at the breakout, second-guessing stops, or holding losers too long. The psychology-first structure is aimed directly at that gap between knowing a pattern and actually trading it.
Who Should Skip This
If you've already worked through Bulkowski's Encyclopedia of Chart Patterns and just want the raw performance statistics without the narrative wrapper, this book will feel like a slower, story-padded version of something you've already got in reference form.
How It Compares
Next to John Murphy's Technical Analysis of the Financial Markets, this book is narrower and far less textbook-like — it skips broader technical theory in favor of a dozen chart patterns taught through narrative and hard statistics. Next to Bulkowski's own Encyclopedia of Chart Patterns, this is the accessible on-ramp: less comprehensive, but built to actually get a beginner trading rather than just cataloging every pattern variant.
Verdict
I'd recommend it to anyone who has the pattern-recognition part down but keeps sabotaging the execution — the trading-psychology chapter alone justifies the read. What surprised me was how willing Bulkowski is to publish a losing trade right alongside the winners, including the Questar example where his own sell signal cost him money in the short run. That kind of transparency is rarer than it should be in this genre, and it's the main reason the book earns more trust than a typical "here's how to read a chart" title.
For the full breakdown of every pattern, statistic, and checklist covered here, check the notes and resources in the sidebar — they're the fastest way to revisit the specifics without rereading the whole book.
Notable Quotes
“"Chart patterns are the footprints of smart money."”
“"Unwillingness to use a stop is what separates an amateur trader from a professional."”
“"Buy it. Read it. Make money."”
Who Should Read This
Traders who can already recognize patterns like triangles or head-and-shoulders formations but keep hesitating at the breakout, second-guessing their stops, or holding losers too long.
Who Should Skip This
Readers who've already worked through Bulkowski's own Encyclopedia of Chart Patterns and just want the raw performance statistics without the narrative, story-driven wrapper.
How It Compares
Next to John Murphy's Technical Analysis of the Financial Markets, this book is narrower and far less textbook-like, trading broad technical theory for a focused set of patterns taught through narrative and hard statistics. Next to Bulkowski's own Encyclopedia of Chart Patterns, it's the accessible on-ramp — less comprehensive, but built to get a beginner actually trading rather than cataloging every pattern variant.
Final Verdict
I'd recommend it to anyone who has the pattern-recognition part down but keeps sabotaging the execution — the trading-psychology chapter alone justifies the read. What surprised me was how willing Bulkowski is to publish a losing trade right alongside the winners, including a sell signal that cost him money in the short run before the market proved him right anyway. That transparency is rarer than it should be in this genre, and it's the main reason this book earns more trust than a typical "how to read a chart" title.