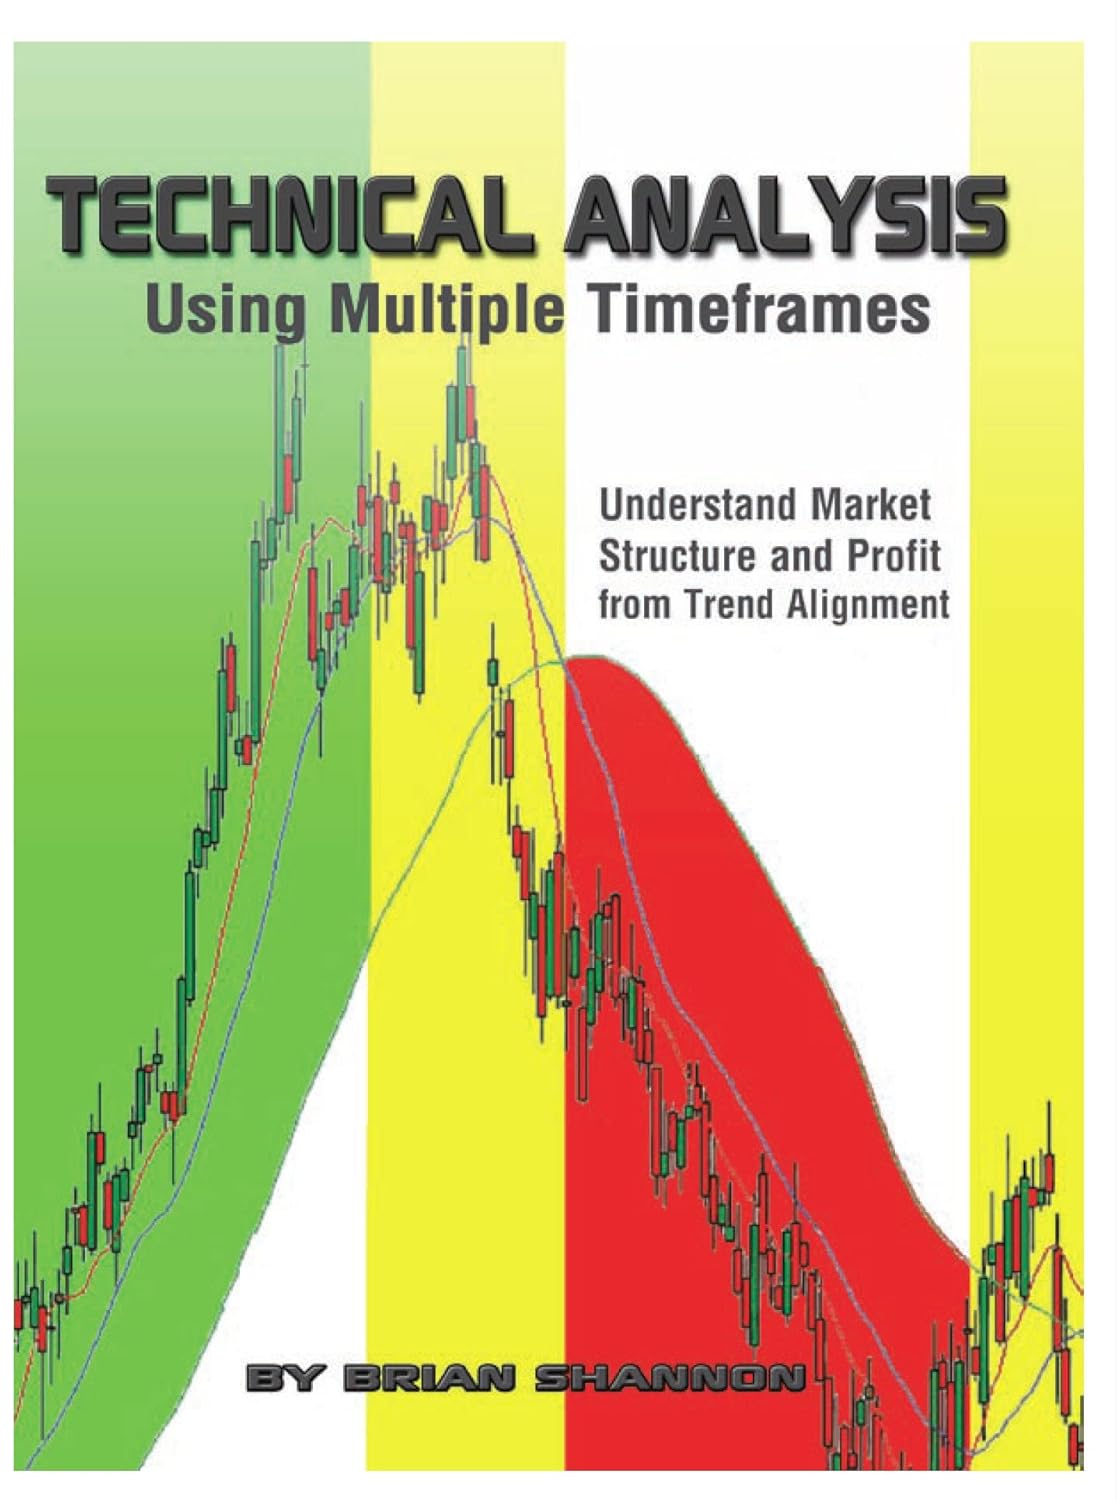
Brian Shannon's guide to reading market structure across timeframes so you stop reacting to noise and start trading in sync with the trend that actually pays.
Key Takeaways
- Every stock cycles through four stages — accumulation, markup, distribution, decline — on every timeframe at once
- Trend alignment means entering only when your short-term timeframe confirms your longer-term trend
- Volume is added to a chart second only to price, because it measures the crowd's emotional conviction
- Your real job as a trader is risk manager first, stock picker second
- Discipline beats prediction — technical analysis organizes information, it doesn't forecast the future
About Brian Shannon
Brian Shannon has been involved full-time in the markets since 1991, working as a broker, owning a day trading firm, managing a hedge fund, and running a proprietary trading desk while being that firm's most profitable trader. He later served as Head of Research and Training for MarketWise, and his work has appeared in Technical Analysis of Stocks & Commodities, Barron's, Active Trader, and Stock Futures and Options Magazine. He is best known for his daily technical analysis videos at alphatrends.net.
I picked this one up because "trade the trend" is advice everyone gives and almost nobody explains well. Brian Shannon actually explains it — not as a slogan, but as a structural way of reading a chart across more than one timeframe at once. If you've ever taken a "textbook" long setup on the daily chart and gotten stopped out because the hourly chart was screaming the opposite message, this book is written for that exact moment of confusion.
This is squarely a technical trader's book, not a fundamentals or valuation book, and Shannon says so upfront. He built his career as a discretionary trader — broker, day-trading firm owner, hedge fund manager, prop trader, and later Head of Research and Training at MarketWise — and the book reads like someone who has actually sat at a desk and lost money before he figured this out.
What Technical Analysis Using Multiple Timeframes Is Really About
The core idea is simple to state and hard to execute: trends exist on every timeframe simultaneously, and the highest-probability trades happen when a shorter-term trend lines up with a longer-term one. Shannon calls this "trend alignment." A one-to-five-day counter-move means nothing to a long-term investor but can be an entire trading career for a day trader — and most traders get hurt by not being honest with themselves about which timeframe they're actually operating in.
Underneath that is a second big idea borrowed and expanded from Stan Weinstein's stage analysis: every stock cycles through four repeating stages — accumulation, markup, distribution, and decline — and this cycle shows up fractally on every timeframe, from a five-minute chart to a monthly one. Once you can recognize which stage a stock is in on multiple timeframes at once, you stop asking "is this a good stock" and start asking "is this a good trade right now."
Key Lessons from Technical Analysis Using Multiple Timeframes
Price Is the Only Objective Information
Shannon is blunt that indicators and oscillators are all derivatives of price and volume, so they're structurally "less important than the actual source of information." His entire framework is built on reading price and volume directly rather than layering on indicator after indicator.
Volume Is the Emotional Gauge
Volume gets its own extended treatment as the second thing added to any chart after price, because it measures the intensity of the crowd's conviction. Rising price on rising volume means something very different from rising price on thinning volume, and Shannon treats that distinction as central to timing entries and exits.
Risk Management Is the Actual Job
He's explicit that a trader's "number one job" is risk manager, not stock picker. The chapter on risk management lays out a 1:3 risk/reward framework based on real support and resistance levels rather than round numbers, and walks through why "death by a thousand paper cuts" — many small losses — kills accounts just as reliably as one catastrophic loss.
Discipline, Not Prediction
A theme that runs through nearly every chapter: technical analysis doesn't predict the market, it organizes information so you can react to it without emotion. Shannon repeatedly separates "systems-based" traders (rules executed by a computer) from "discretionary" traders like himself, and is honest that neither approach is inherently superior — it comes down to personality fit.
Technical Analysis Using Multiple Timeframes Chapter Breakdown
The book moves in a deliberate build: Chapter 1 makes the case for technical analysis as a complete decision-making framework, not just a set of patterns. Chapters 2 through 6 dig into the four-stage cycle (accumulation, markup, distribution, decline) stock by stock and stage by stage. Chapters 7 through 10 cover the classic toolkit — support and resistance, trends, volume, and moving averages — but always tied back to the multi-timeframe lens rather than treated as standalone topics.
Chapter 11, simply titled "Time," is where the book's actual thesis crystallizes: this is where Shannon formally introduces trend alignment and leans on Dow Theory as its historical foundation. From there, Chapters 12 through 15 get tactical — when to buy, when to sell short, how news and fundamentals interact with technical setups, and how to handle short squeezes. Chapter 16 is risk management and exit strategy, Chapter 17 collects rules and trading insight, and Chapter 18, "Putting It All Together," is a genuinely useful walk-through of Shannon's actual weekly and daily routine for building a watchlist — not a vague "here's how I think," but the literal mechanics of how he narrows 300–400 stocks down to a daily trading list.
Where the Book Falls Short
My honest pushback: this book rewards a trader who already has some chart-reading vocabulary. If you don't already know what a moving average or a support level is, the multi-timeframe concept will wash over you rather than click. It's also very much a product of its era — the chart examples run on RealTick software circa 2008, and the entire lens is equities-focused, so options traders, forex traders, and crypto traders will need to do their own translation work. There's also real repetition; concepts like "price is the only thing that pays" and "emotions are the enemy" get restated across multiple chapters, which reinforces the point but occasionally feels like padding rather than new material. And because Shannon is explicitly a discretionary trader, readers hoping for a rules-based, backtestable system won't find one here — the book is closer to a mentorship in judgment than a mechanical playbook.
Who Gets the Most Out of This
This book earns its keep for a trader who already understands basic chart reading but keeps getting whipsawed — someone taking a "textbook" setup on one timeframe only to get stopped out by noise on another. It's built for swing and short-term equity traders trying to formalize why some of their setups work and others don't.
If you're a pure buy-and-hold investor, or you're still learning what a candlestick is, this probably isn't your first book — Shannon assumes baseline chart literacy and moves fast into the multi-timeframe framework without much hand-holding on fundamentals.
How It Compares
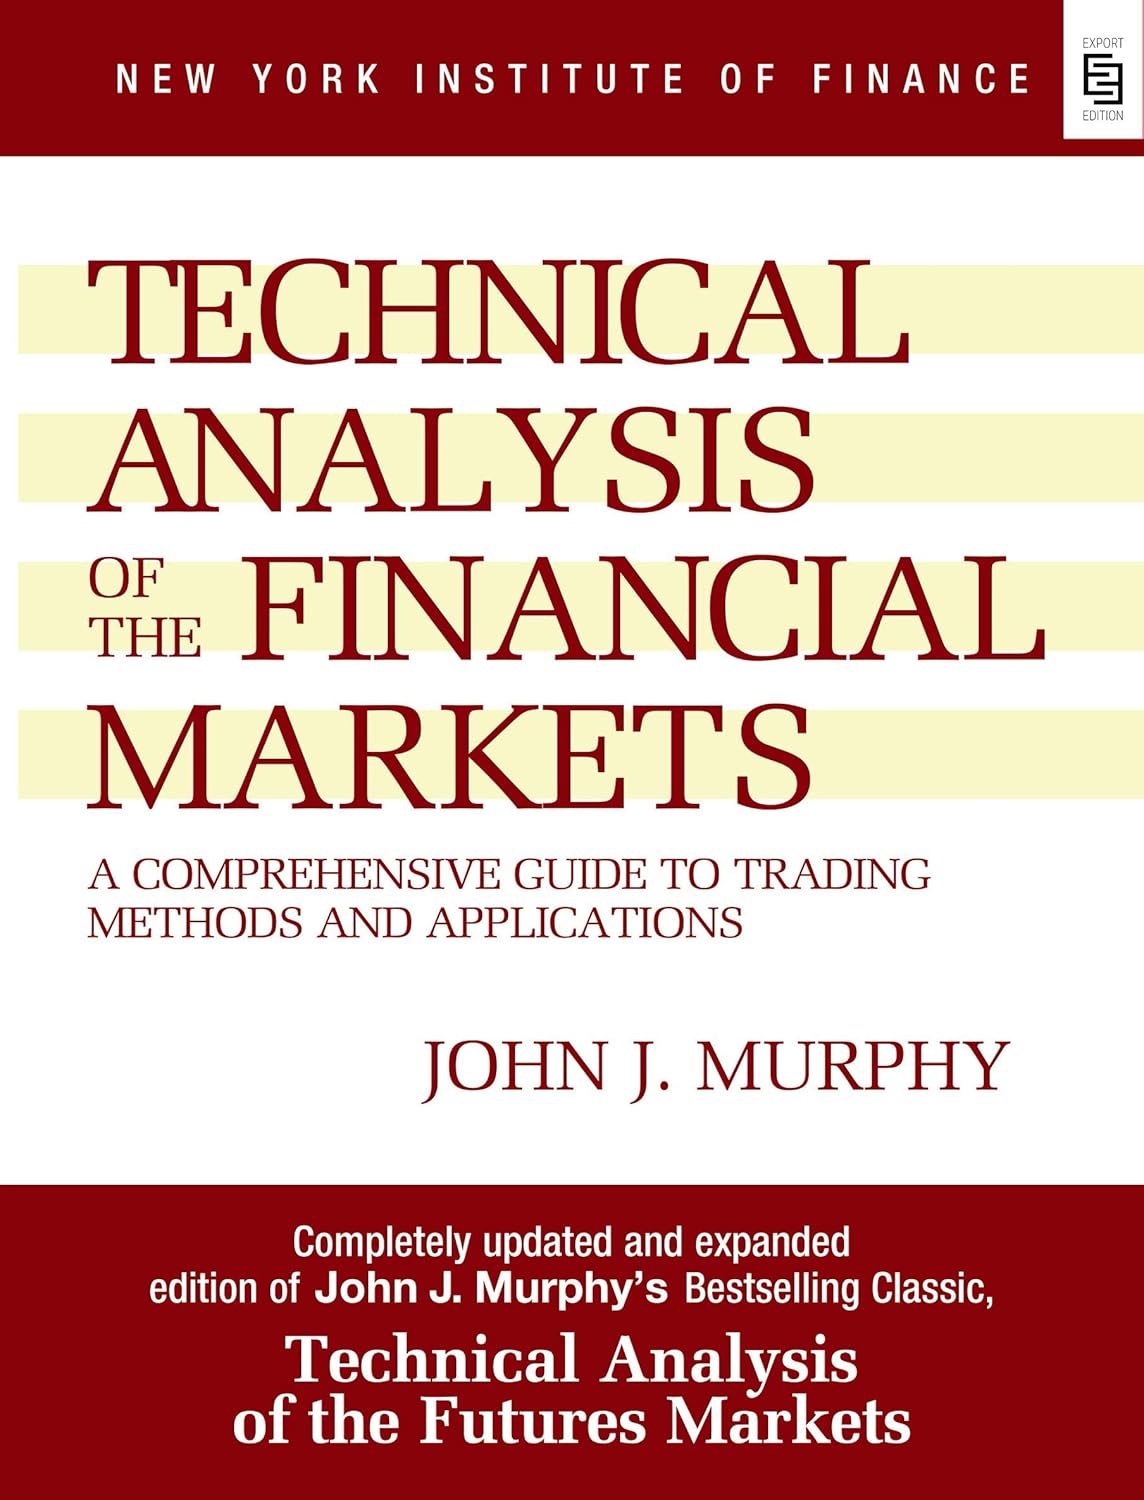
Compared to John Murphy's "Technical Analysis of the Financial Markets," which functions more like an encyclopedia of every indicator and pattern, Shannon's book is narrower and more opinionated — it's built around one core thesis (trend alignment across timeframes) rather than surveying the whole field. It's also more explicitly personality-driven and discretionary than Stan Weinstein's "Secrets for Profiting in Bull and Bear Markets," which Shannon draws his stage analysis from but applies across timeframes rather than a single one.
My Verdict
I'd recommend this to any intermediate technical trader who's frustrated by conflicting signals across timeframes — that's the specific, common problem this book solves better than most. What surprised me most was how candid Shannon is about discipline and losses; there's no "secret indicator" energy here, and the risk management chapter alone is worth the read. My real pushback is that the book sells itself as a complete system but is really a mental framework — you'll finish it understanding *why* trend alignment matters far more than you'll finish it with a plug-and-play checklist, and traders looking for the latter should pair this with a more mechanical resource.
For the specific chapter notes, quotes, and a condensed cheat-sheet version of Shannon's stage analysis and trend alignment framework, check the resources in the sidebar.
Notable Quotes
“"A trend, once established, is more likely to continue than it is to reverse."”
“"There are no good stocks, only good trades."”
“"No one makes money in the markets all the time. No one!"”
Who Should Read This
Swing and short-term equity traders who already understand basic chart reading but keep getting stopped out by conflicting signals across different timeframes.
Who Should Skip This
Pure buy-and-hold investors and complete beginners who don't yet know basic technical terms like moving averages or support levels — the book assumes that vocabulary and moves quickly.
How It Compares
Where John Murphy's "Technical Analysis of the Financial Markets" reads like an encyclopedia of every indicator and pattern, Shannon's book is narrower and built around one thesis — trend alignment across timeframes. It also leans more explicitly discretionary than Stan Weinstein's "Secrets for Profiting in Bull and Bear Markets," whose stage analysis Shannon borrows and stretches across multiple timeframes.
Final Verdict
Solid, honest recommendation for intermediate technical traders frustrated by mixed signals — the risk management chapter and the "putting it all together" routine are worth the price alone. What surprised me was how little "secret sauce" energy there is; Shannon leans hard into discipline and losses instead. My pushback: it's sold as a complete system but is really a mental framework, so pair it with something more mechanical if you want a plug-and-play checklist.