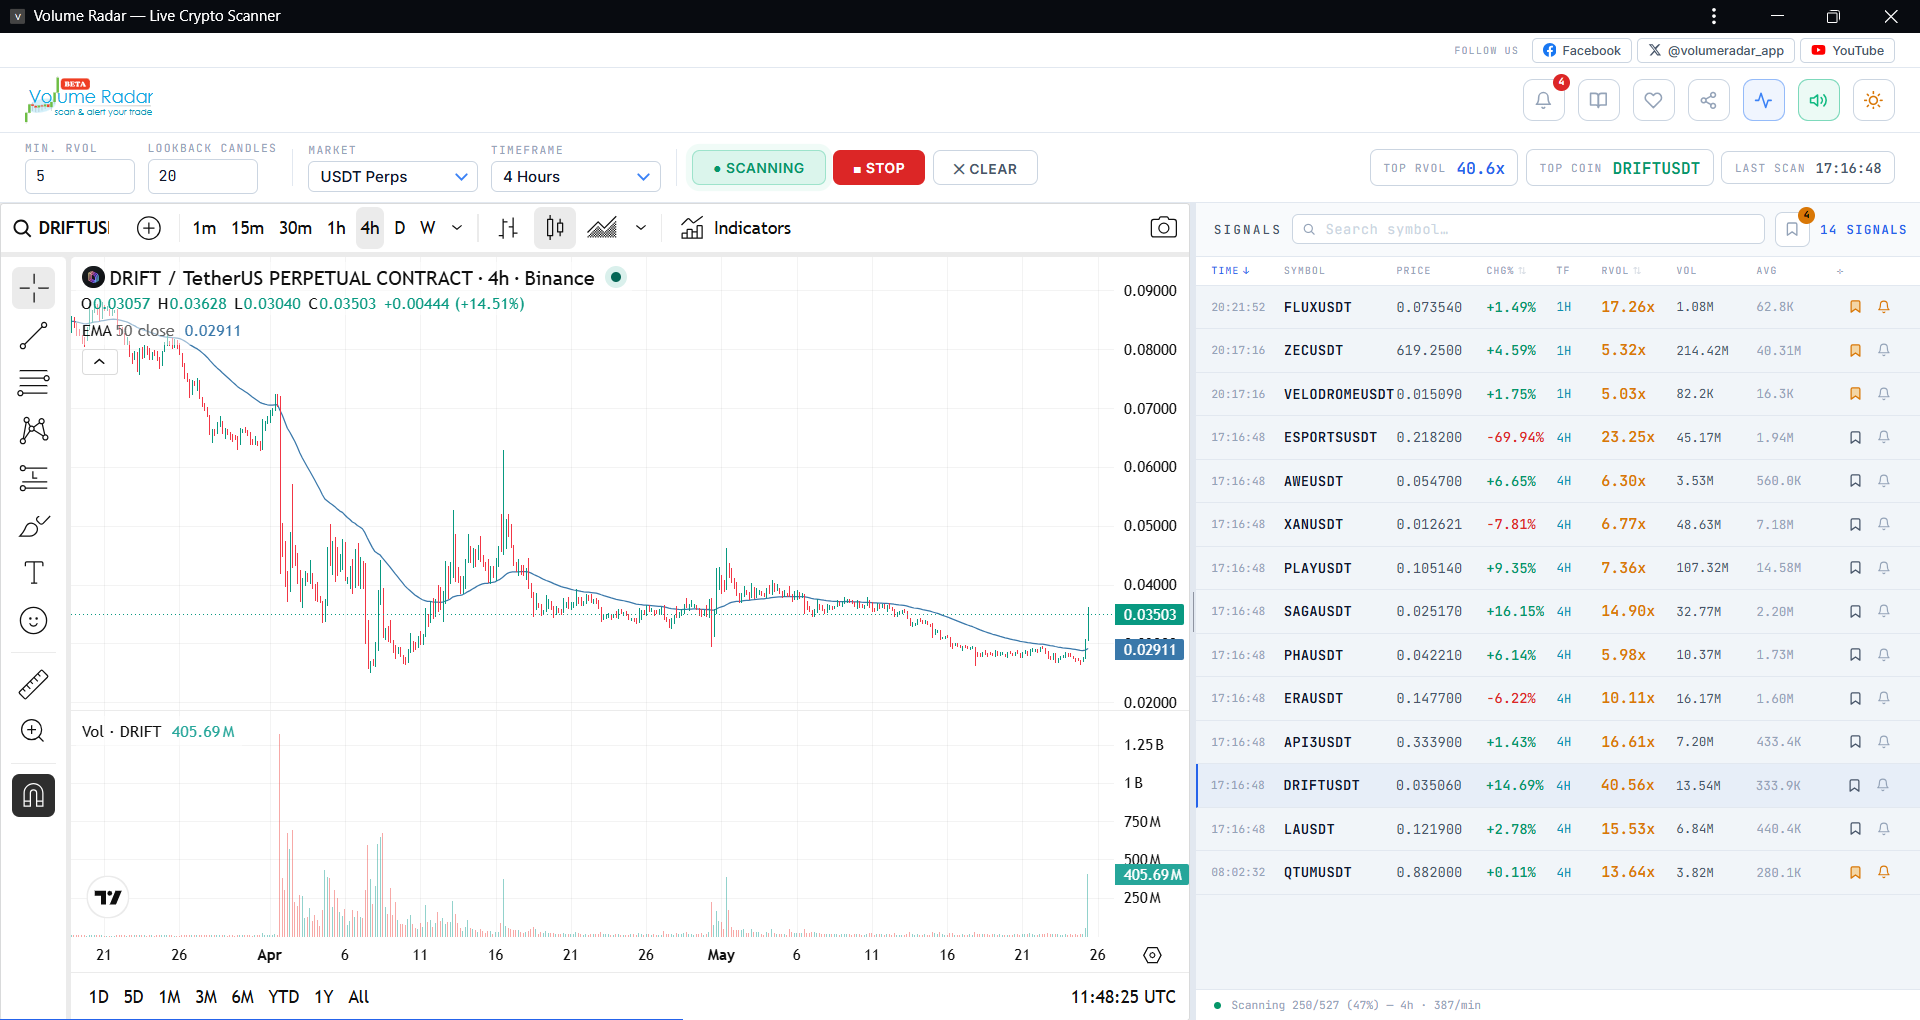
Market Structure - Base for all type of trading styles.
Market Structure in Trading
Market Structure is one of the most important concepts in technical analysis and price action trading. It helps traders understand the overall direction of the market by analyzing swing highs, swing lows, trend continuation, and trend reversals. Instead of relying only on indicators, many professional traders focus on market structure because it provides a clearer understanding of how buyers and sellers interact. This article contains dummy content intended for testing layouts, typography, and long-form content on a website. The information is educational and should not be considered financial advice.
Understanding Market Structure
The market constantly moves between bullish trends, bearish trends, and ranging conditions. Recognizing these phases allows traders to make better decisions regarding entries, exits, and risk management. A bullish market generally creates higher highs and higher lows, while a bearish market forms lower highs and lower lows. Sideways markets often produce overlapping candles with limited momentum. Understanding these simple patterns can significantly improve trading discipline and consistency.
Market structure analysis starts with identifying important swing points on the chart. Every movement creates temporary highs and lows that define the current trend. Strong buying pressure usually results in higher prices, whereas increasing selling pressure creates lower prices. By comparing recent swings, a trader can determine whether the market is strengthening, weakening, or consolidating before the next major move.
Bullish Market Structure
A bullish structure exists when the market continues to create higher highs (HH) and higher lows (HL). Each correction remains above the previous swing low, indicating that buyers are still in control. Traders often wait for pullbacks toward support levels before looking for buying opportunities. Patience is essential because entering after extended price moves may increase risk while reducing potential reward.
Dummy content continues here to simulate a long educational article. Imagine a chart where price rallies, retraces modestly, and then resumes its upward movement. This sequence repeats multiple times, forming a staircase-like pattern. The repeated formation of higher highs and higher lows provides confidence that institutional buying interest may still be supporting the overall trend.
Bearish Market Structure
A bearish market structure forms when price creates lower highs (LH) and lower lows (LL). Sellers gain control, preventing buyers from pushing prices above previous resistance levels. Traders often look for short-selling opportunities during retracements, especially when price rejects important resistance zones. Risk management remains essential because counter-trend rallies can occur unexpectedly.
Markets rarely move in perfectly straight lines. Even during strong downtrends, temporary rallies can appear due to profit booking, short covering, or news events. Successful traders focus on identifying whether these rallies represent genuine reversals or merely corrections before the primary trend resumes. This distinction often separates experienced traders from beginners.
Break of Structure (BOS)
A Break of Structure occurs when price successfully breaks an important swing high or swing low in the direction of the prevailing trend. Many traders interpret BOS as confirmation that momentum continues to favor the current trend. However, confirmation should always be combined with proper volume analysis, support and resistance levels, and broader market context.
For example, if an uptrend produces another higher high after respecting the previous higher low, traders may classify this movement as a bullish break of structure. Likewise, during a downtrend, breaking below the previous swing low strengthens bearish sentiment. Although BOS is widely discussed in modern price action strategies, it should not be used in isolation.
Change of Character (CHOCH)
Change of Character, commonly abbreviated as CHOCH, represents an early indication that the existing trend might be weakening. A bullish market that suddenly breaks below an important higher low may signal a potential shift toward bearish conditions. Similarly, a bearish market that breaks above a significant lower high could indicate growing buying pressure.
CHOCH does not automatically guarantee a trend reversal. Instead, it serves as an early warning signal that traders should observe additional confirmations before making decisions. Many professionals combine CHOCH with liquidity analysis, candlestick confirmation, and volume expansion for greater confidence.
Support and Resistance
Support represents an area where buying interest has historically exceeded selling pressure, preventing further price declines. Resistance represents an area where sellers have historically entered the market, slowing or reversing upward movement. These levels often align closely with important market structure points, making them valuable references for trade planning.
Rather than treating support and resistance as exact lines, experienced traders often view them as zones. Price may briefly move beyond these zones before reversing sharply. This behavior frequently occurs due to liquidity collection, stop-loss hunting, and temporary market imbalance.
Importance of Volume
Volume provides additional insight into market structure by measuring participation. Strong breakouts accompanied by increasing volume generally carry greater credibility than breakouts occurring on weak volume. Likewise, declining volume during a trend may indicate slowing momentum, suggesting that traders should remain cautious.
Many trading platforms provide Relative Volume (RVOL), allowing traders to compare current trading activity against historical averages. Elevated RVOL often highlights stocks or cryptocurrencies experiencing unusual interest from market participants. Combining RVOL with market structure can help identify high-probability trading opportunities.
Risk Management
Even the strongest market structure cannot eliminate trading risk. Every trade should include predefined entry criteria, stop-loss placement, and profit targets. Consistent position sizing helps traders survive periods of losing trades while preserving capital for future opportunities.
Professional traders often focus more on managing losses than maximizing profits. Limiting downside risk allows them to remain emotionally balanced and execute their trading plans consistently. Over time, disciplined risk management frequently contributes more to long-term success than individual winning trades.
Common Mistakes
New traders often misinterpret small price fluctuations as major trend changes. Others chase breakouts after large candles without waiting for confirmation. Emotional decision-making, excessive leverage, poor stop-loss placement, and inconsistent trade execution frequently reduce profitability. Developing patience and following a structured trading plan can help avoid these mistakes.
Another common mistake involves ignoring higher timeframes. A bullish setup on a five-minute chart may actually be a bearish pullback on the daily chart. Multi-timeframe analysis provides additional context and helps traders align short-term decisions with the broader market trend.
Practical Example
Imagine a stock trading at $100. Price rises to $110 before retracing to $105. Buyers return, pushing price to $115. The market then pulls back only to $108 before continuing toward $120. This sequence of higher highs and higher lows demonstrates a healthy bullish market structure. A trader might choose to buy near the higher low while placing a stop-loss below recent support.
Conversely, suppose the same stock falls from $120 to $112, rallies to $116, then declines to $108. Another rally reaches only $111 before price drops to $102. This pattern creates lower highs and lower lows, illustrating bearish market structure. Traders may prefer selling rallies rather than buying dips until evidence of trend reversal appears.
Conclusion
Market Structure remains one of the foundational concepts in technical trading because it reflects the continuous interaction between buyers and sellers. By studying swing highs, swing lows, trend direction, breaks of structure, and changes of character, traders can improve their understanding of price behavior. Although no strategy guarantees success, combining market structure with proper risk management, volume analysis, and disciplined execution can help create a more consistent trading process.
This dummy article intentionally exceeds one thousand words to provide realistic long-form content for website testing. It is suitable for evaluating typography, spacing, responsive layouts, reading experience, SEO formatting, and HTML rendering. Developers can freely duplicate sections, modify headings, insert images, tables, code examples, advertisements, or call-to-action elements depending on their project requirements.